QEEGs
This section is an expert contribution from Dr. Craig Tanio.
Dr. Craig Tanio is the co-founder of Rezilir Health, a clinical group specializing in reversing preventable chronic disease with a focus on the prevention and reversal of early Alzheimer’s and Chronic Inflammatory Response Syndrome. All sources in this section can be found in our RESOURCES section.
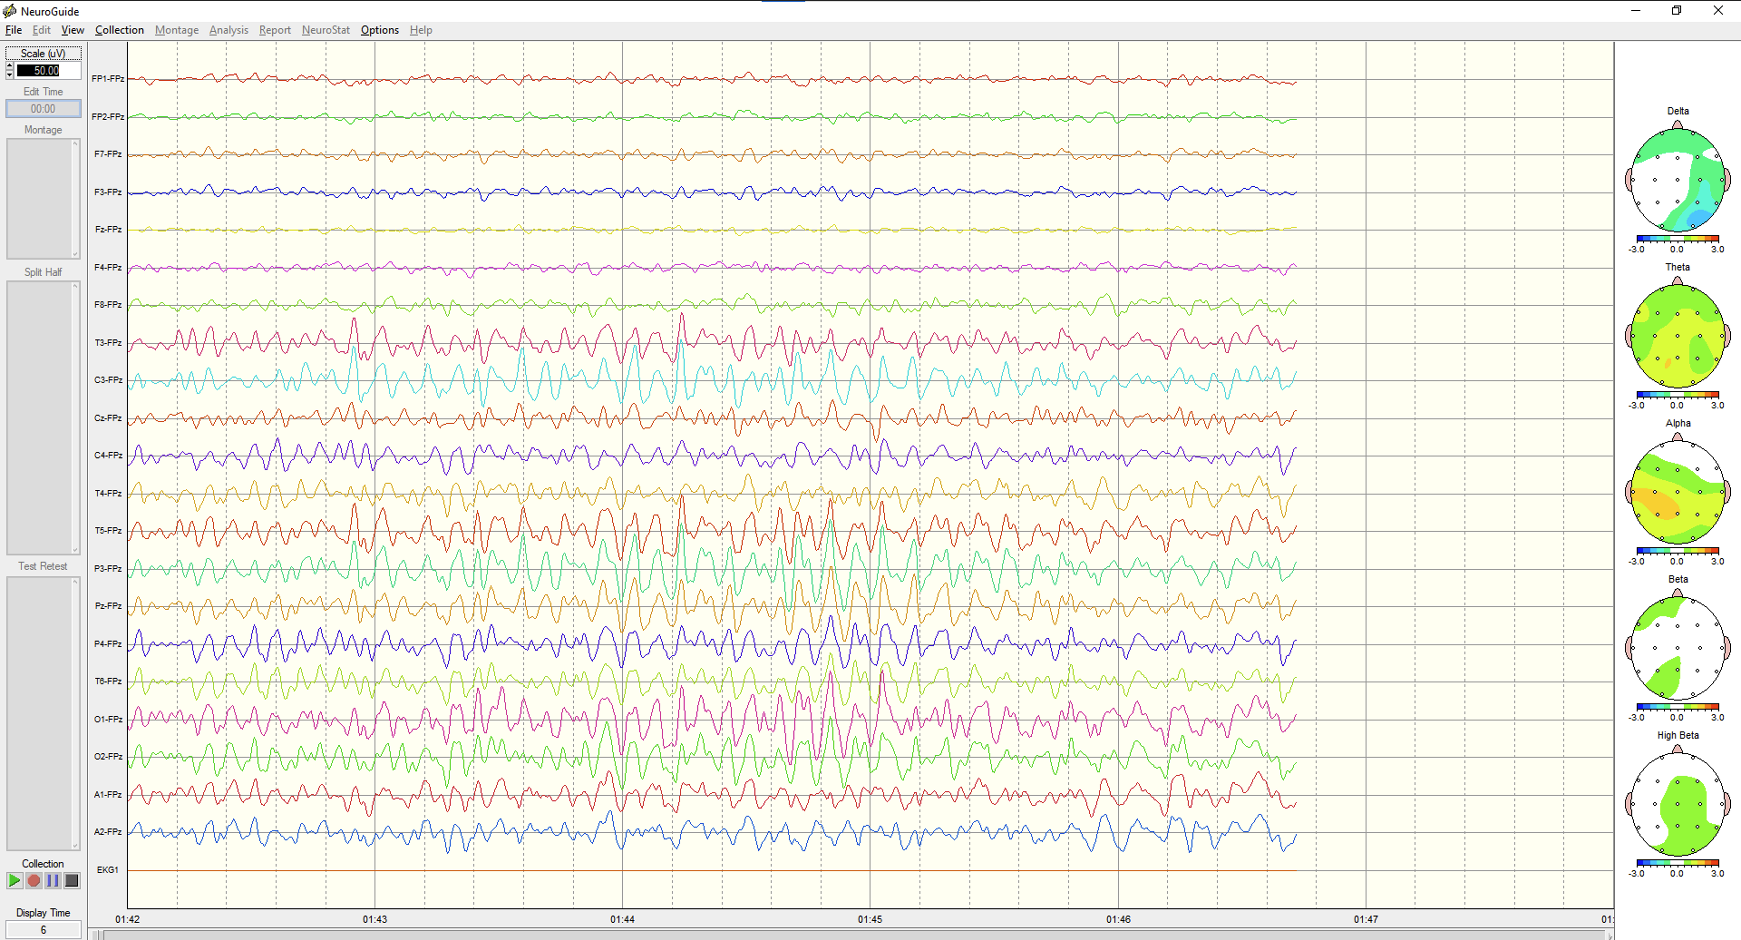
Quantitative EEGs (also known as QEEGs or Qs) are an objective way of looking at the brain’s functional performance at any point in time. Nineteen electrodes are placed on the skull, and the brain’s electrical activity is measured and analyzed through software such as Neuroguide, which compares the brain’s activity to a database of healthy controls. The brain’s electrical activity occurs primarily at frequencies from 1 Hertz (cycle per second) to 30 Hertz. Delta (1-5 Hertz) are the slowest brain waves associated with deep sleep and unconsciousness. Theta (6-10 Hertz) are slow brain waves that are associated with drowsiness and relaxation. Alpha (11 -15 Hz) are waves that are activated in deep, relaxed meditative concentration and a state of alertness. Beta waves are faster brain waves associated with alertness, concentration, and problem-solving in the Low Beta (16-24 Hz) and High Beta (26-30 Hz) ranges.
An EEG tracing can look like the image below as it is being collected. Brain waves, captured on the left, and a “brain map,” depicted on the right, reflect the brain’s activity. White is normal activity, yellow is higher activity, and red is the highest activity.
QEEGs can be used to measure the strength and frequency of these different brain waves and to identify any abnormalities or deviations from normal patterns of brain activity. We can see both under-activity and over-activity in the brain, measured by Z scores (1 standard deviation = Z score of 1), and as such, the QEEG can be used to understand the individual’s brain performance and as a tool for diagnosis and monitoring as well.
Software can convert the flat map of the brain into a 3D overview of network activity using the “connectome” database created by the NIH (National Institutes of Health) during the Obama administration.
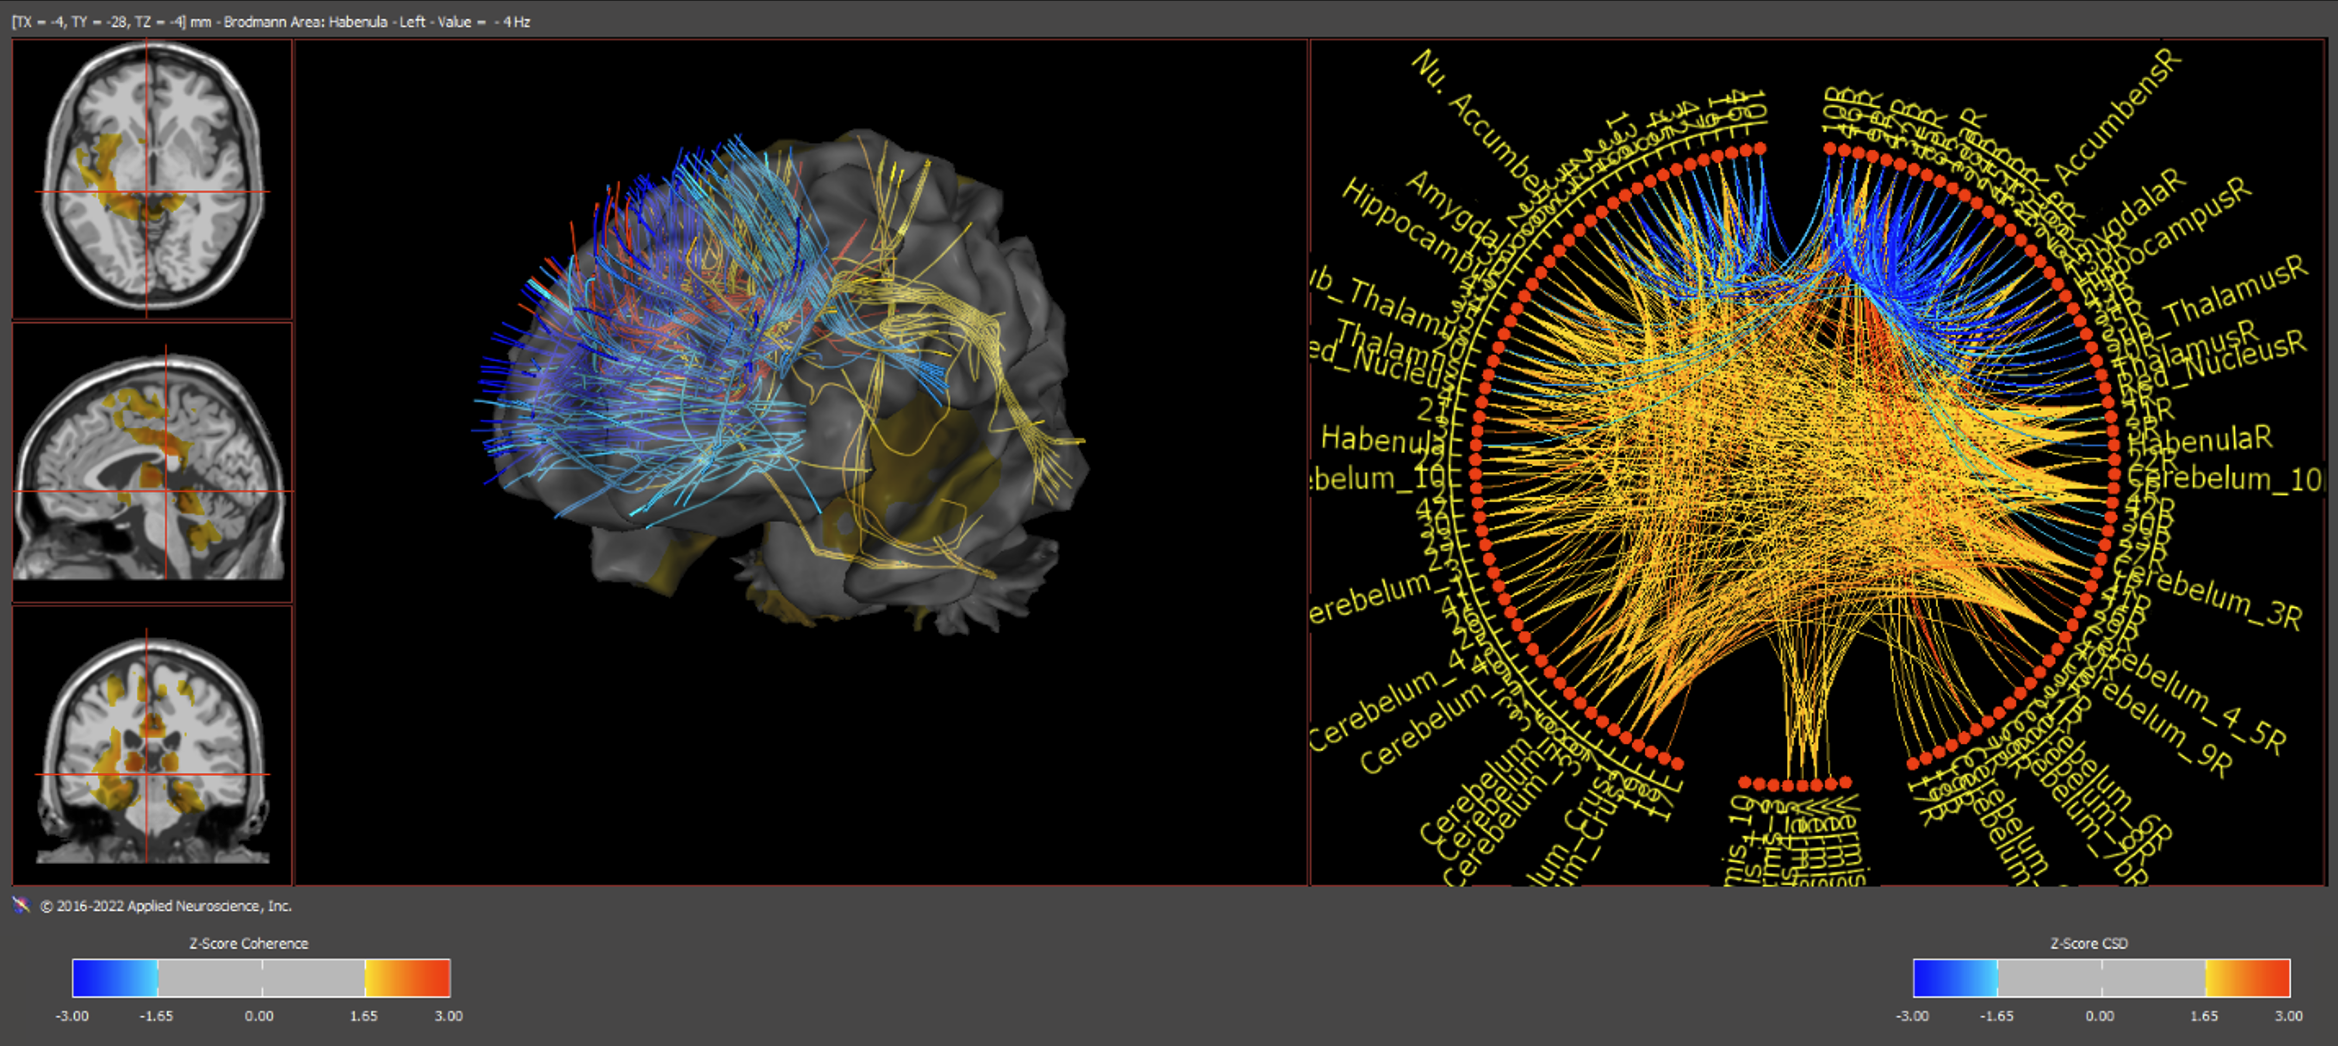
This allows much more precision in understanding how brain networks may be subtly dysregulated, resulting in suboptimal performance in cognition, focus, concentration, emotions, and moods.